Is Pairs Trading Still Viable?
Thu Aug 29 2019 by Brian StanleyClassic pairs trading strategies have suffered deteriorating returns over time. Can a research pipeline that facilitates the identification and selection of ETF pairs make pairs trading viable again? This post investigates such a pipeline.
The problem: pairs wander away
Pairs trading is a classic arbitrage strategy on securities in the same industry (for example, Coke and Pepsi) in which the trader buys one security and sells the other when the spread between them widens, then closes the positions when the spread narrows again.
In his book Algorithmic Trading, Ernie Chan notes that pairs trading of stocks has become more difficult over time. Two stocks may cointegrate in-sample, but they often wander apart out-of-sample as the fortunes of the respective companies diverge. However, Chan finds more fertile ground for pairs trading among ETFs.
I backtest a pairs trading strategy using an ETF pair from Chan's book, GLD and GDX (the Gold ETF and Gold Miners ETF), and find that this pair was profitable out-of-sample for 2 years after Chan's book was published but thereafter became unprofitable.
Based on the tendency of pairs to eventually stop cointegrating, I hypothesize that successful pairs trading requires a robust pipeline for continually identifying and selecting new pairs to trade. I attempt to construct such pipeline using a 3-step process:
- For a universe of all liquid US ETFs, I test all possible pairs for cointegration using the Johansen test in an in-sample window.
- I run in-sample backtests on all cointegrating pairs and select the 5 best performing pairs.
- I run an out-of-sample backtest on a portfolio of the 5 best performing pairs.
Pairs trading strategy
I create a Moonshot pairs trading strategy that replicates the trading rules in Chan's book. A few code snippets are highlighed here. The strategy calculates daily hedge ratios using the Johansen test:
from statsmodels.tsa.vector_ar.vecm import coint_johansen

# The second and third parameters indicate constant term, with a lag of 1.
# See Chan, Algorithmic Trading, chapter 2.
result = coint_johansen(pair_prices, 0, 1)

# The first column of eigenvectors contains the best weights
hedge_ratios = list(result.evec[0])
The timing of entries and exits is based on Bollinger Bands set one standard deviation away from the spread's moving average:
# Compute spread and Bollinger Bands
spreads = (pair_prices * hedge_ratios).sum(axis=1)
means = spreads.fillna(method="ffill").rolling(20).mean()
stds = spreads.fillna(method="ffill").rolling(20).std()
upper_bands = means + stds
lower_bands = means - stds

# Long (short) the spread when it crosses below (above) the lower (upper)
# band, then exit when it crosses the mean
long_entries = spreads < lower_bands
long_exits = spreads >= means
short_entries = spreads > upper_bands
short_exits = spreads <= means
See the code repository link at the end of the article for the full source code.
Backtest using GLD and GDX
I backtest the pairs trading strategy using GLD and GDX, the Gold and Gold Miners ETFs, which Chan discusses in his book. Chan's book was published in 2013, so this provides an out-of-sample evaluation of the trading strategy.
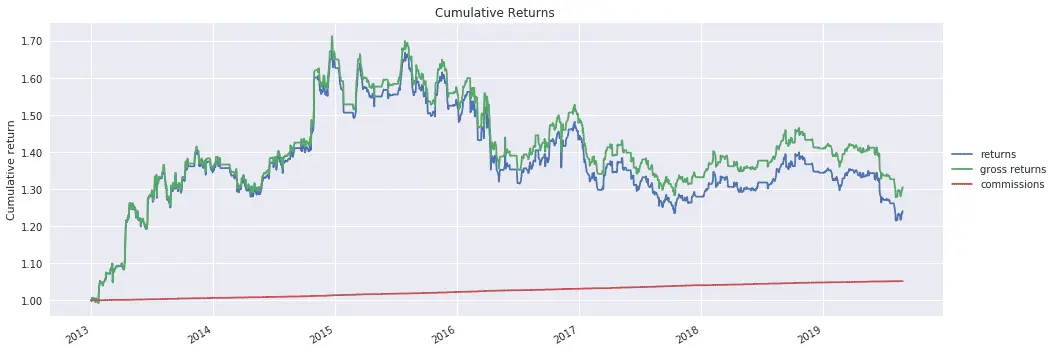
The strategy was profitable for the first two years following publication, but was unprofitable thereafter.
Pairs selection pipeline with US ETFs
Next, in a Jupyter notebook, I construct a pipeline for identifying and selecting new pairs.
Step 1: Filter by dollar volume
I begin by collecting 1-day historical bars for all US ETFs. I then filter the universe of ETFs to include only liquid ETFs, defined here as having average daily dollar volume above $10M USD. This results in a universe of 110 ETFs.
Step 2: In-sample cointegration test
110 ETFs can be combined into nearly 6,000 possible pairs. I test all 6,000 pairs for cointegration using the Johansen test for the period of 2011. This results in 110 pairs that cointegrate with a confidence level of at least 90%.
Step 3: In-sample backtests
Next, I run Moonshot backtests on all 110 cointegrating pairs for the period 2012-2015, and select the 5 best performing pairs, shown below:
| Ticker1 | Ticker2 | Sharpe Ratio 2012-2015 |
|---|---|---|
| USO - UNITED STATES OIL FUND LP | DUG - PROSHARES ULTRASHORT OIL&GAS | 1.03 |
| LQD - ISHARES IBOXX INVESTMENT GRA | QID - PROSHARES ULTRASHORT QQQ | 0.96 |
| ICF - ISHARES COHEN & STEERS REIT | FAZ- DIREXION DAILY FIN BEAR 3X | 0.71 |
| VNQ - VANGUARD REAL ESTATE ETF | FAZ - DIREXION DAILY FIN BEAR 3X | 0.70 |
| XLI - INDUSTRIAL SELECT SECT SPDR | IWR - ISHARES RUSSELL MID-CAP ETF | 0.69 |
Some of the pairs are intuitive if unexpected (LQD and QID) while others don't seem to make intuitive sense (USO and DUG). (Note that the presence of several leveraged ETFs in the top 5 could be problematic as these can be expensive to borrow for shorting, so it might be preferable to exclude them.)
Out-of-sample backtest of best performing pairs
Finally, I run an out-of-sample backtest on the 5 best performing pairs:
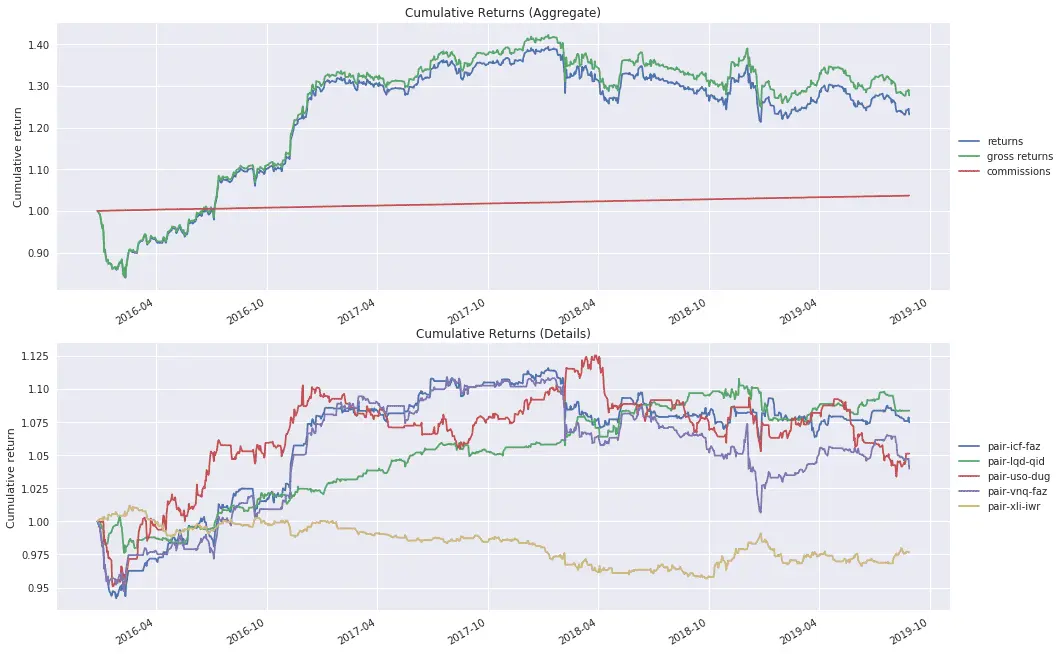
The aggregate portfolio of pairs performs well in the first two years out of sample, but then performance deteriorates, mirroring the out-of-sample equity curve of GLD/GDX. This may indicate that the out-of-sample lifespan of a well-performing pair is at most two years, implying a need to re-run cointegration tests and in-sample backtests every year or two in order to update the portfolio of best pairs.
Conclusion
Pairs that cointegrate and perform well in-sample cannot be expected to perform well out-of-sample indefinitely. However, a small period of out-of-sample cointegration lasting a year or two before deterioration sets in may be reasonable to expect. This implies that successful pairs trading requires a robust research pipeline for continually identifying and selecting new pairs to replace old pairs that stop working.
Explore this research on your own
This research was created with QuantRocket. Clone the pairs-pipeline repository to get the code and perform your own analysis.
quantrocket codeload clone 'pairs-pipeline' Send a Message