Does forced buying and selling of underlying shares by leveraged ETF sponsors cause predictable intraday price moves? This post explores an intraday momentum strategy based on the premise that it does.
Daily rebalancing of leveraged ETFs
Per their fund objectives, leveraged ETFs must maintain a constant daily leverage relative to their underlying index (usually 2x or 3x leverage). As Ernie Chan points out in his book Algorithmic Trading, doing so requires that the ETF sponsors buy more underlying shares on days the shares go up and sell shares on days the shares go down. The larger the gain or loss, the more shares the fund will have to buy or sell to maintain the proper leverage.
This is simply based on the math of using leverage: with 2x leverage, a 10% drop in the underlying index results in only a %5 drop in the leveraged portfolio value, which results in a higher leverage if not rebalanced. (See example 8.1 in Chan's book for further discussion.)
Based on this insight, Chan proposes a trading strategy that buys (sells) leveraged ETFs in the afternoon trading session following a significant intraday gain (loss), in expectation of further buying (selling) by the leveraged ETF sponsors heading into the close.
Leveraged ETF trading strategy
I create a Moonshot strategy to test Chan's idea using 15-min data from Interactive Brokers. The strategy calculates the return from the prior close to 2 PM and takes a long or short position when the gain or loss is more than +/-2% and holds until the close. The Pandas code is shown below:
closes = prices.loc["Close"]
opens = prices.loc["Open"]

# Take a cross section (xs) of prices to get a specific time's price;
# the close of the 15:45 bar is the session close
session_closes = closes.xs("15:45:00", level="Time")
# the open of the 14:00 bar is the 14:00 price
afternoon_prices = opens.xs("14:00:00", level="Time")

# calculate the return from yesterday's close to 14:00
prior_closes = session_closes.shift()
returns = (afternoon_prices - prior_closes) / prior_closes

# Go long if up more than 2%, go short if down more than -2%
long_signals = returns > 0.02
short_signals = returns < -0.02
Backtest using DRN
I first backtest the trading strategy using DRN, a real estate ETF which Chan uses for this strategy in his book. Attempting to replicate an author's result as closely as possible before adding your own variations to the strategy is a good way to validate your code. Since Chan's book was published in 2013, this backtest allows us to view the strategy's out-of-sample performance.
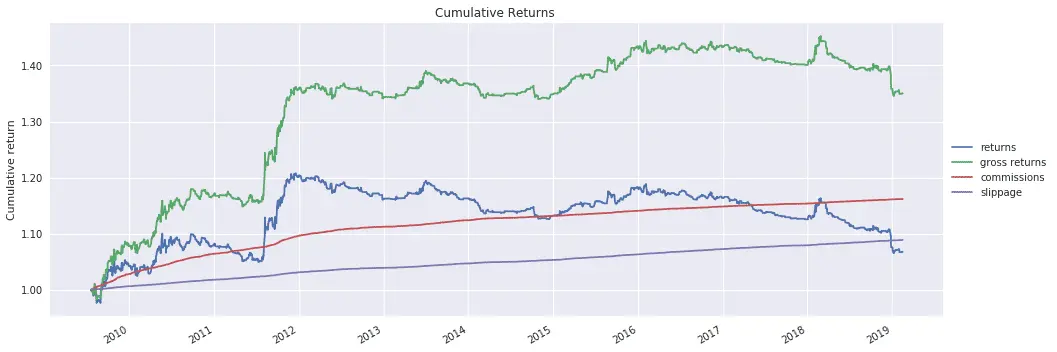
The DRN strategy performs well in Chan's in-sample period of 2011-2012 but is unprofitable after transaction costs in subsequent years.
Multi-ETF backtest
Next, I re-run the strategy on a portfolio of 14 leveraged ETFs. Testing a trading strategy with multiple securities provides better validation of the underlying concept and reduces the potential for data mining bias. Frequently it also improves the Sharpe ratio as a result of diversification.
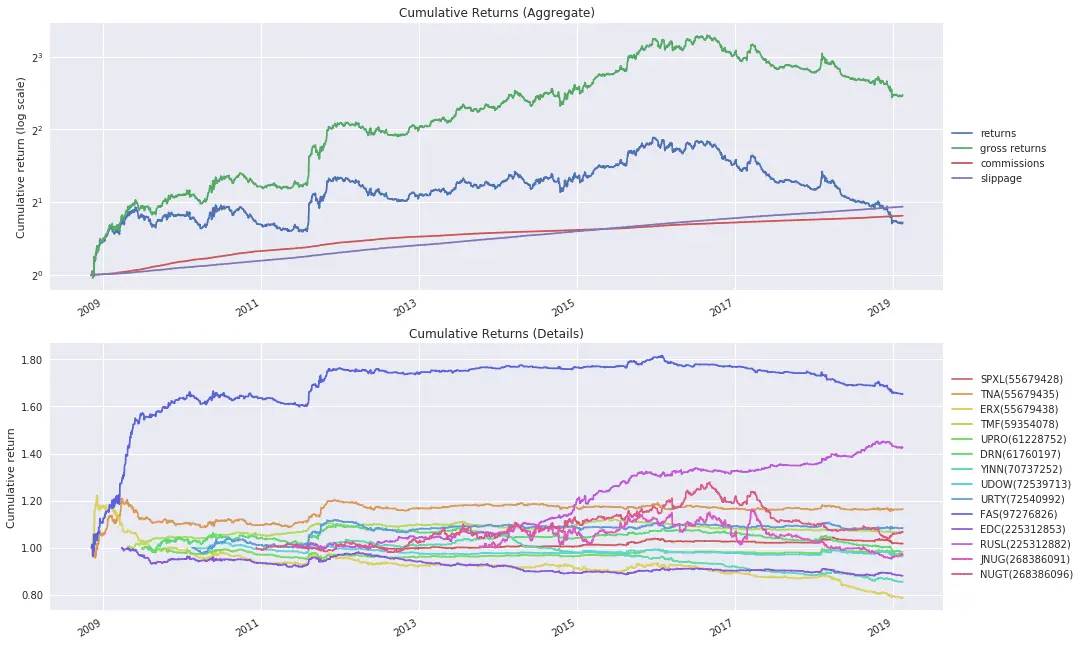
The multi-ETF variant is profitable through mid-2016 but declines thereafter.
How large should the intraday move be?
The above backtests require an intraday move of +/-2%. As most of the leveraged ETFs in the backtest use 3x leverage, this requires a move of only +/-0.67% in the underlying index. Since larger intraday moves should require larger quantities of buying or selling by the ETF sponsors, perhaps we should adjust the backtest to use a larger threshold.
The following parameter scan tests thresholds of 2, 4, 6, and 8%.
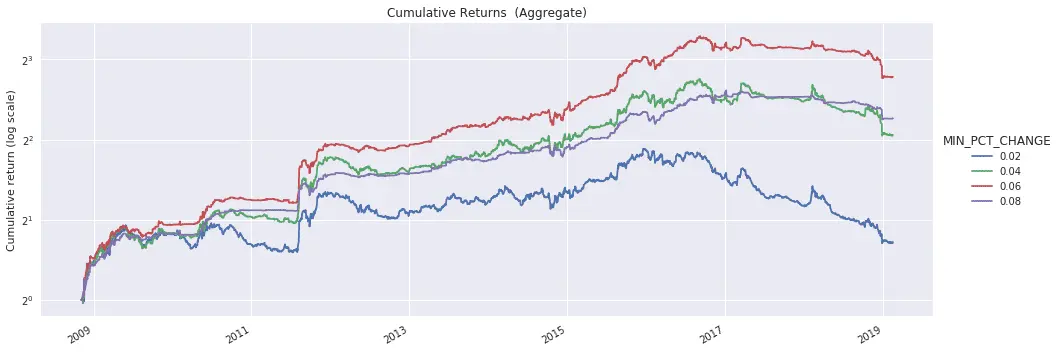
A threshold of +/-6% provides a compound annual growth rate of 31% after transaction costs and an attractive Sharpe ratio of 1.95 for the period 2008-2016. However, the strategy flattens out beginning in 2017.
Conclusion
Ernie Chan's leveraged ETF momentum strategy provides intriguing historical performance when run on a portfolio of multiple ETFs and when adjusted to require a larger intraday move. The flattening out of performance starting in 2017 raises the question of whether the strategy is taking a pause or has suffered permanent alpha decay. If the latter, it remains to be seen whether a similar phenomenon exists in international markets.
Explore this research on your own
This research was created with QuantRocket. Clone the trend-day repository to get the code and perform your own analysis.
quantrocket codeload clone 'trend-day' Send a Message