Market Cap vs Dollar Volume: Which to Use for Universe Selection?
Thu Oct 19 2023 by Brian StanleyMarket cap and dollar volume are two commonly used metrics for filtering a trading universe by size of security. Does it matter which one you use? In this post, I quantify the difference between market cap and dollar volume and explain the kinds of stocks that may unexpectedly appear in your universe with each metric.
Overview of market cap and dollar volume
Market cap and dollar volume are both proxies for size but are conceptually different. Market cap is a valuation measure that reflects how much the market thinks a company is worth. It is calculated by multiplying the share price by the number of shares outstanding. Dollar volume is a liquidity measure that reflects how easy it is to trade in and out of a stock. It is calculated by multiplying the share price by the volume of shares traded over a given period. Market cap tells us something about the company — how valuable it is — while dollar volume tells us something about the stock — how active it is.
The choice to use market cap or dollar volume is often dictated by the available data. Market cap is typically provided with fundamental data, because the number of outstanding shares is reported in a company's financial statements. If you don't have fundamental data, it's an easy choice to use dollar volume, which can be calculated from price and volume alone.
If you have both price and fundamental data, the choice might depend on what type of strategy you're researching. If you're a long-term investor using fundamental data to identify companies with certain qualities, market cap is a natural choice since it tells you something about the company. If you're a trader targeting short-term moves in a security, liquidity may be paramount, making dollar volume a natural choice.
How correlated are market cap and dollar volume?
For the most part, we expect market cap and dollar volume to be correlated: a company like Apple has a large market cap and is highly liquid, while we expect a tiny startup to have a low market cap and be illiquid. To visualize this correlation, I use the Pipeline API to rank all US stocks (excluding ETFs) by market cap and dollar volume from smallest to largest and make a scatter plot of the results. The red regression line represents perfect correlation, where a stock's dollar volume rank exactly equals its market cap rank.
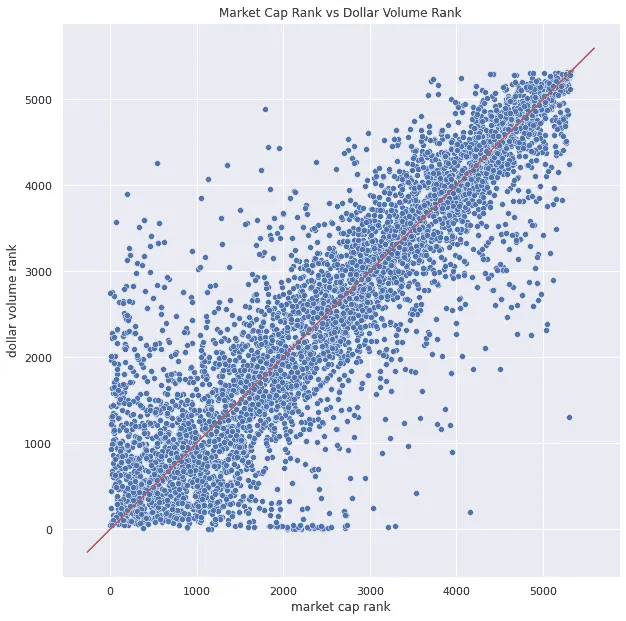
While there is clearly a strong correlation between market cap and dollar volume — most points cluster along the red line — there are also many points that are far from the red regression line, indicating securities that rank much lower on one metric than the other.
Large cap stocks vs high dollar volume stocks
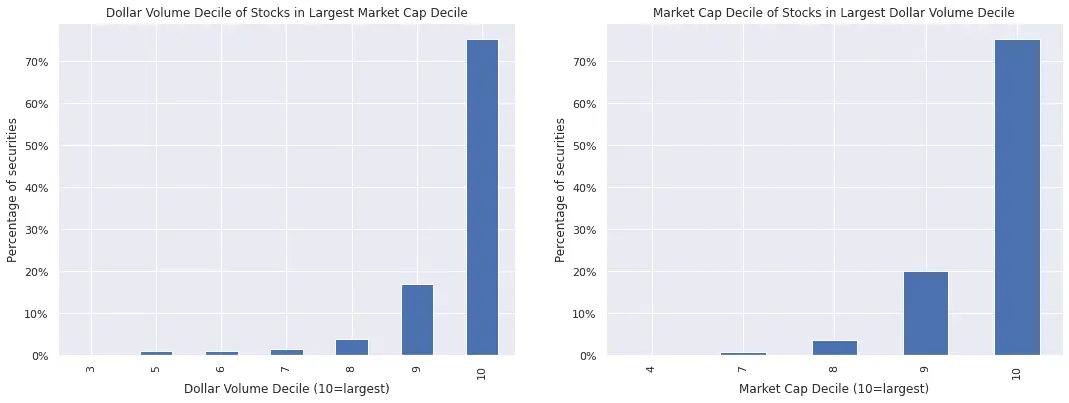
In the next two plots, I focus on the largest and most liquid stocks. In the left-hand plot, I show how the top market cap decile is distributed across dollar volume deciles, and in the right-hand plot, I show how the top dollar volume decile is distributed across market cap deciles. In other words, in the left-hand plot, we are asking how liquid the largest companies are, and in the right-hand plot, we are asking how large the most liquid companies are.
The top market cap decile and the top dollar volume decile share about 75% common membership. These are stocks like Apple — liquid and large. Another 15% of the top market cap decile comes from the second largest dollar volume decile (decile 9) — stocks that are still quite liquid. But the remaining 10% of large cap stocks come from lower dollar volume deciles, as low as dollar volume decile 3. Similarly for the top dollar volume decile, about 20% of the stocks come from the second largest market cap decile (decile 9), but the remaining 5% of stocks come from market cap deciles as low as decile 4.
What's in your universe?
Next, I sort and filter my pipeline results to inspect some of these low decile stocks that are showing up in my high decile screens.
What kinds of stocks have high market cap but low dollar volume? Most of the stocks in this category are ADRs (American Depository Receipts) of large foreign companies. These companies' stocks primarily trade in their home countries and are not as widely traded in the US. Investors who exclude ADRs in addition to filtering by market cap will remove most of the low dollar volume stocks from their large cap universe.
Conversely, what kinds of stocks have high dollar volume but low market cap? A sampling of names that currently surface from my pipeline screen are Tupperware (TUP), Nikola (NKLA), and Affirm (AFRM). These are all meme stocks popular with retail traders. The companies are struggling in various ways and thus have lower market caps, but they are heavily traded by retail traders and thus have high dollar volumes. Traders who filter their universe by dollar volume expecting to get S&P-500-caliber stocks should be mindful of the presence of such securities.
Explore this research on your own
This research was created with QuantRocket. Get the code from GitHub and perform your own analysis.
About QuantRocket
QuantRocket is a Python-based platform for researching, backtesting, and trading quantitative strategies. It provides a JupyterLab environment, offers a suite of data integrations, and supports multiple backtesters: Zipline, the open-source backtester that originally powered Quantopian; Alphalens, an alpha factor analysis library; Moonshot, a vectorized backtester based on pandas; and MoonshotML, a walk-forward machine learning backtester. Built on Docker, QuantRocket can be deployed locally or to the cloud and has an open architecture that is flexible and extensible.
Learn more or install QuantRocket now to get started.
 Send a Message