What's Better, High Profit Margins or Improving Profit Margins?
Wed Jul 12 2023 by Brian StanleyShould investors prefer companies with high profit margins or companies with improving profit margins? Is it better to own an unprofitable company that's getting better, or a profitable company that's getting worse? This post explores these questions by analyzing the profitability growth factor and how it interacts with the profitability and size factors to impact stock performance.
Profitability vs Profitability Growth
In a previous post, we saw that the stocks of very unprofitable companies (defined as companies with negative operating margins) perform worse than other stocks. We looked at a snapshot of profitability, but that doesn't tell us anything about the trend of profitability over time. The top quantile in our analysis may have included companies that were profitable but in decline, and the bottom quantile may have included companies that were unprofitable but getting better. In this article, I modify the analysis to look at profitability growth, that is, the change in profitability over time.
How to Calculate Profitability Growth in Pipeline
To facilitate measuring changes in fundamentals over time, the Pipeline API provides a variety of built-in "periodic" functions for performing arbitrary computations spanning multiple fiscal periods. You can calculate average revenue over the last 8 quarters, compare EPS to its 4-year range, or screen for companies that haven't cut their dividend in the last 10 years.
We can calculate the change in profitability using the built-in PeriodicChange() function. Previously, we created an operating margin factor that included various refinements such as excluding companies with zero revenue. To use this factor with PeriodicChange(), we put the factor logic inside a function that accepts a period_offset argument; this argument controls the fiscal period to query. (See the notebook linked at the end of the article for a more detailed explanation.)
from zipline.pipeline import sharadar

def OPMARGIN(period_offset=0, mask=None):
    """
    Return an operating margin factor for the specified period_offset.
    """
    fundamentals = sharadar.Fundamentals.slice("ART", period_offset)
    revenue = fundamentals.REVENUE.latest
    operating_margin = fundamentals.OPINC.latest / revenue.where(revenue > 0)

    # exclude companies with negative operating expenses or negative cost of revenue
    opex = fundamentals.OPEX.latest
    cor = fundamentals.COR.latest
    operating_margin = operating_margin.where((opex > 0) & (cor > 0))

    # clip range to (-1, 1) so as not to overweight outliers
    operating_margin = operating_margin.clip(min_bound=-1, max_bound=1)

    if mask is not None:
        operating_margin = operating_margin.where(mask)

    return operating_margin
For this analysis, I calculate the 1-year (4-quarter) change in profitability by passing the above function to PeriodicChange() with a window_length of 4:
from zipline.pipeline.periodic import PeriodicChange

profitability_growth = PeriodicChange(OPMARGIN, window_length=4)
Analyzing How Different Factors Interact
I want Alphalens to answer several questions about profitability growth.
First, is profitability growth predictive of future returns? Do companies with improving operating margins outperform companies with deteriorating operating margins? Intuitively, we hypothesize that this will be the case.
Second, assuming profitability growth is predictive, how does it relate to profitability? To put the question in practical terms: if I buy a basket of companies with improving margins, am I mostly buying already profitable companies, or am I also buying many unprofitable companies that are becoming less unprofitable (and thus showing positive growth)? We learned in a previous post that very unprofitable companies are bad investments, so mixing unprofitability (something bad) with profitability growth (something we expect to be good) in a single quantile seems likely to cloud the picture. It would be nice to see a separate breakdown of factor performance for profitable vs unprofitable companies.
Alphalens can provide such a breakdown if we pass it one or more secondary factors as grouping factors. So, I include a simple boolean column in my pipeline that captures whether a company is currently profitable:
is_profitable = OPMARGIN() > 0My third question is how the profitability growth factor interacts with the size factor. Breaking down factor performance by market cap is a generally useful practice in fundamental factor analysis. Due to their higher volatility, very small companies can potentially mask the effect of the factor you're trying to study if the small caps cluster in particular quantiles. Including market cap as a grouping factor allows you to spot when this is happening. I split the market into 4 size quantiles:
fundamentals = sharadar.Fundamentals.slice("ART")
size = fundamentals.MARKETCAP.latest.quantiles(4)
I put my primary and secondary factors into a Pipeline:
from zipline.pipeline import Pipeline

pipeline = Pipeline(
    columns={
        'profitability_growth': profitability_growth,
        'is_profitable': is_profitable,
        'size': size
    }
)
And I pass the pipeline to Alphalens, specifying the secondary factors in the groupby parameter:
import alphalens as al

al.from_pipeline(
    pipeline,
    start_date="1999-02-01",
    end_date="2022-12-30",
    # name of the pipeline column containing the primary factor to analyze
    factor="profitability_growth",
    # split the data into 4 quantiles, by profitability_growth
    quantiles=4,
    # don't mix positive and negative values in a single quantile
    zero_aware=True,
    # analyze forward returns over 1, 5, and 21 trading days
    periods=[1, 5, 21],
    # one or more secondary factors to group the primary factor by
    groupby=[
        "is_profitable",
        "size"
    ],
    # run the analysis in 1-year chunks to reduce memory usage
    segment="Y"
)
Results
Factor Distribution
Let's look at the mean column. On average, the operating margins of companies in the bottom quantile (quantile 1) decline by 14 percentage points year-over-year, while the operating margins of companies in the top quantile (quantile 4) increase by 13 percentage points. The average change in operating margin for the two middle quantiles is -1 percentage point and +1 percentage point, respectively — not very different. In other words, there are a large number of companies in the middle of the distribution with stable operating margins.
| min | max | mean | std | count | avg daily count | count % | |
|---|---|---|---|---|---|---|---|
| Profitability Growth Quantile | |||||||
| 1 (most negative) | -1.841 | -0.018 | -0.143 | 0.189 | 4,262,031 | 712.8 | 23.1% |
| 2 | -0.055 | -0.000 | -0.011 | 0.009 | 4,259,046 | 712.3 | 23.1% |
| 3 | 0.000 | 0.047 | 0.008 | 0.007 | 4,951,693 | 828.2 | 26.9% |
| 4 (most positive) | 0.003 | 1.892 | 0.134 | 0.186 | 4,948,689 | 827.7 | 26.9% |
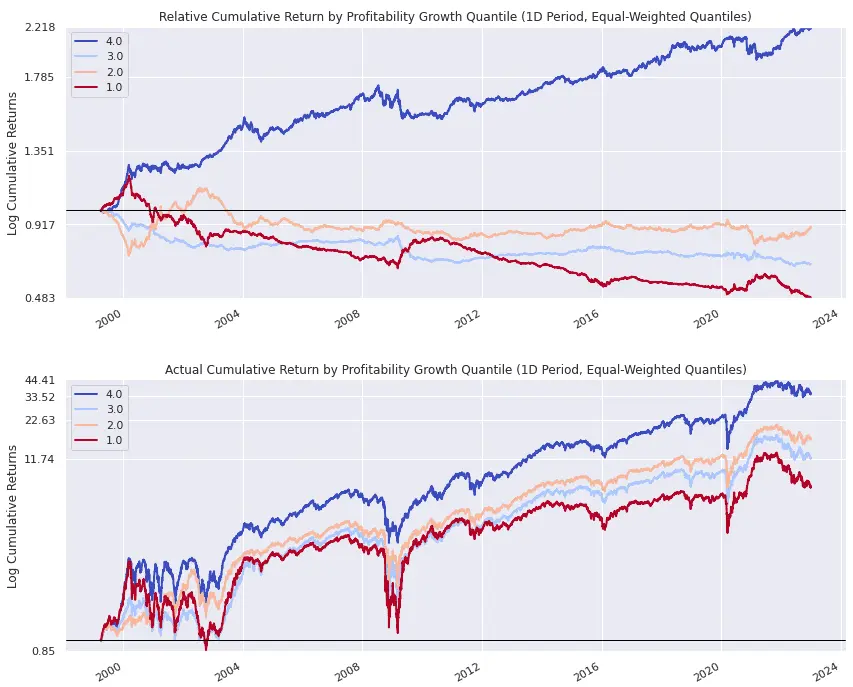
Relative and Actual Cumulative Return by Profitability Growth Quantile
In the following cumulative return plots, we see that companies with improving operating margins (quantile 4, blue line) clearly outperform companies with deteriorating operating margins (quantile 1, red line). The middle quantiles (2 and 3) perform fairly similarly to each other, which perhaps shouldn't be surprising since the companies in these quantiles have stable operating margins. Somewhat more surprising is that the performance of the middle quantiles is only a little better than the performance of the bottom quantile. In other words, although companies with deteriorating operating margins fare somewhat worse than companies with stable operating margins, the real story is that companies with improving operating margins strongly outperform everything else.
This answers the first question I posed above: profitability growth leads to superior returns.
Profitability Subgroup Analysis
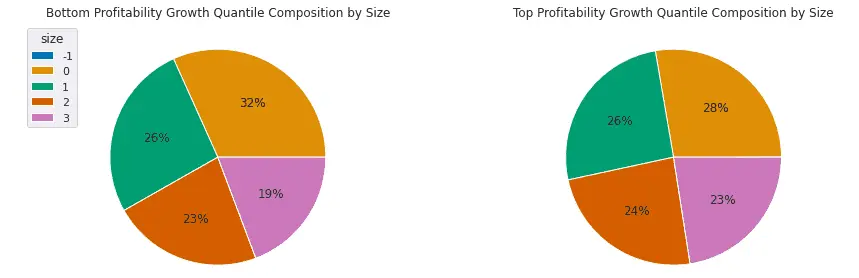
The second question I posed was whether a basket of stocks with improving operating margins consists mostly of profitable companies or whether it also includes many unprofitable companies that are becoming less unprofitable. Because we included current profitability as a secondary grouping factor, Alphalens shows us the composition of the top and bottom profitability growth quantile by the grouping factor. Looking at the right-hand pie chart, we see that three-fourths of companies in the top quantile (improving operating margins) are profitable, while one-fourth are unprofitable. As shown in the left-hand pie chart, the bottom quantile (deteriorating operating margins) is split roughly equally between profitable and unprofitable companies.
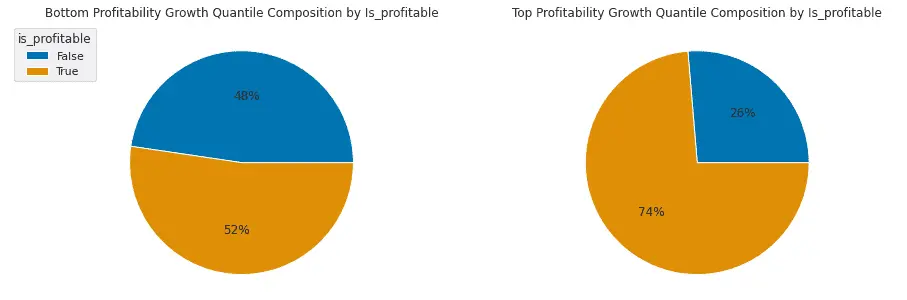
Considering the presence of unprofitable companies in the top profitability growth quantile (right-hand pie chart), a new question emerges. Can we do better by excluding the 26% of unprofitable companies from our profitability growth portfolio? In other words, does having two good characteristics (improving operating margins and currently profitable) yield better results than having only one good characteristic (improving operating margins but still unprofitable)?
In the pair of plots below, Alphalens has split the market into profitable and unprofitable companies and has separately plotted the mean return by profitability growth quantile within each subgroup.
The red arrows compare the performance of profitability growth quantile 4 (companies with improving operating margins) in the two subgroups. We see that the quantile 4 return is a little higher in the profitable subgroup than in the unprofitable subgroup, but it is a fairly small difference, suggesting that there is a benefit, but only a modest one, to combining profitability and profitability growth.
The paired plots also allow us to answer another question I posed at the beginning of the article: is it better to own an unprofitable company that's getting better, or a profitable company that's getting worse? The blue arrows compare profitability growth quantile 4 in the unprofitable subgroup with profitability growth quantile 1 in the profitable subgroup. We see that it is better to own an unprofitable company that's getting better than a profitable company that's getting worse.
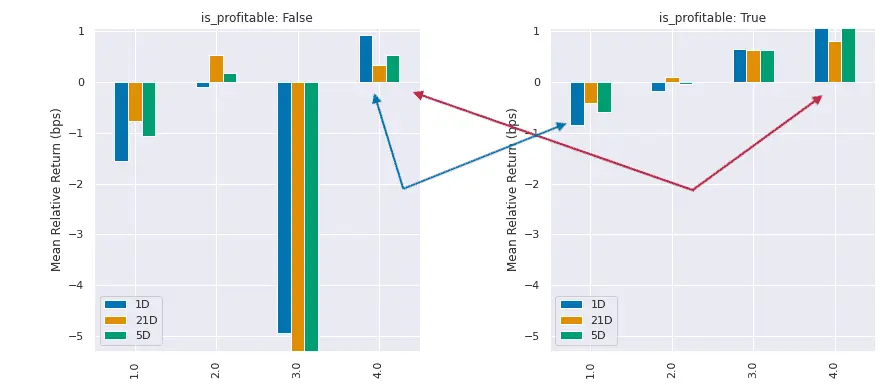
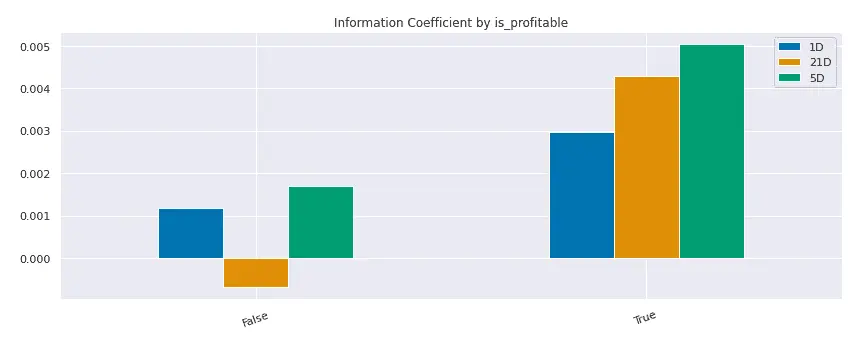
A final point to note in the above plots is that, in the profitable subgroup on the right, performance increases monotonically with profitability growth, while in the unprofitable subgroup on the left, the effect of profitability growth on performance is noisier and more erratic (for example, quantile 3 performs worst). This suggests that profitability growth is a more reliable indicator of future performance among profitable companies than among unprofitable companies. This is confirmed by the following plot, which shows a higher information coefficient (a measure of the correlation between factor values and future returns) for the profitable subgroup than for the unprofitable subgroup.
Market Cap Subgroup Analysis
Looking at market cap, we first check whether small or large companies are clustering in the top or bottom quantile. The answer is mostly no: smaller companies (size quantile 0) are slightly overrepresented in the bottom quantile, but overall the bottom and top profitability growth quantiles contain companies of all sizes.
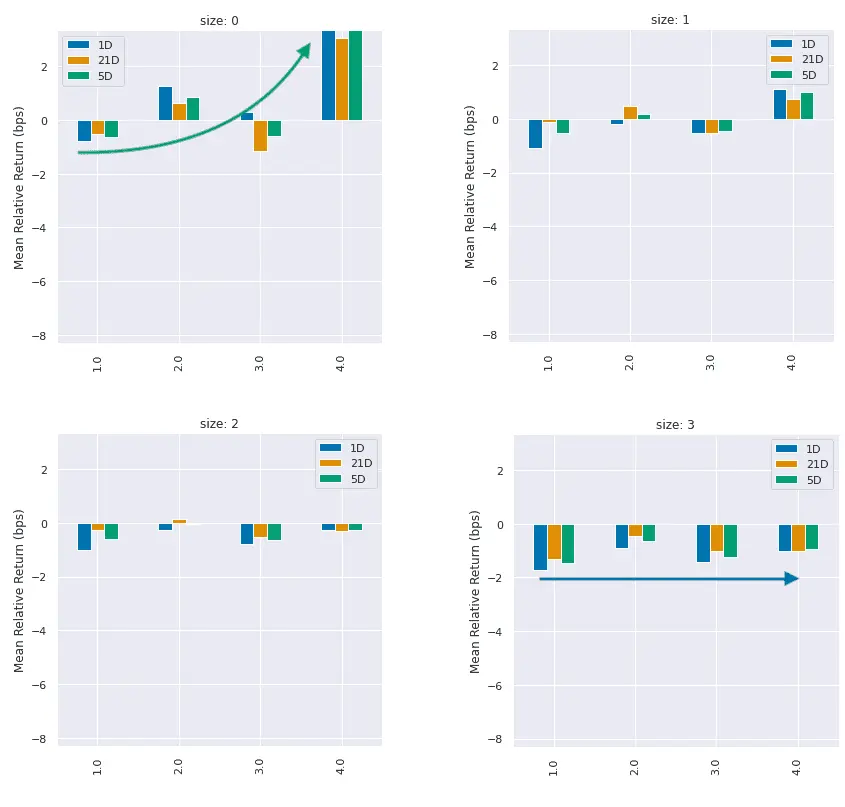
How does profitability growth affect performance within different market cap subgroups? The plots below show that profitability growth is primarily predictive among small cap companies. In size quantile 0 (the smallest companies), companies with improving operating margins (factor quantile 4) outperform other companies (see green arrow). In contrast, in size quantile 3 (the largest companies), performance varies little across the 4 profitability growth quantiles (see blue arrow). The takeaway is that screening for profitability growth primarily makes sense as a way to find small companies on the up-and-up. Profitability growth among large companies is less important.
Explore this research on your own
This research was created with QuantRocket. Clone the fundamental-factors repository to get the code and perform your own analysis.
quantrocket codeload clone 'fundamental-factors' Send a Message