Analyzing the Profitability Factor with Alphalens
Tue Jun 27 2023 by Brian StanleyHow does a company's profitability affect its stock returns? In this post, I use Alphalens, a Python library for analyzing alpha factors, to investigate the relationship between operating margin, a profitability ratio, and future returns.
The Operating Margin Factor
In the preceding post, we looked at operating margin, one of three main profitability ratios along with gross margin and net margin. I said that operating margin is an appealing metric for measuring a company's core operational performance, due to the kinds of expenses that are included and excluded from its calculation.
Starting with the basic formula for operating margin — operating income divided by revenue — we refined the formula based on several issues that exploratory data analysis brought to light. Specifically, we excluded companies with no revenue and companies with negative operating expenses or negative cost of revenue, and we clipped extreme negative outliers. The complete factor definition is shown below:
from zipline.pipeline import sharadar

# ART = as-reported, trailing-twelve-months fundamentals
fundamentals = sharadar.Fundamentals.slice('ART')

revenue = fundamentals.REVENUE.latest
operating_margin = fundamentals.OPINC.latest / revenue.where(revenue > 0)

# exclude companies with negative operating expenses or negative cost of revenue
opex = fundamentals.OPEX.latest
cor = fundamentals.COR.latest
operating_margin = operating_margin.where((opex > 0) & (cor > 0))

# clip range to (-1, 1) so as not to overweight outliers
operating_margin = operating_margin.clip(min_bound=-1, max_bound=1)(REVENUE - COR - INTEXP - SGNA) / EQUITY.Where Alphalens Fits in the Research Process
Before we analyze operating margin with Alphalens, let's take a step back and consider where Alphalens fits in the research process.
Alphalens is an open-source Python library for analyzing and quantifying the predictive potential of alpha factors. Alphalens was originally created by Quantopian and is among several Quantopian libraries that QuantRocket maintains. Alphalens takes factor data (such as the output of running a pipeline) and creates a tear sheet containing plots and tables that show the relative performance of baskets of stocks formed with the alpha factor.
Previously, we saw that exploratory data analysis (EDA) is a useful first step for getting to know a fundamental factor and discovering and addressing any data complications that might otherwise cause problems later on. After you've completed EDA, using Alphalens to analyze your factor's predictive value is a logical next step in the research process. A benefit of Alphalens is that you can get feedback on whether a factor looks promising without having to write much code. Promising factors can be investigated further or used in backtests, while unpromising factors can be abandoned with little loss of the researcher's time.
Is Alphalens Only for Factor Investors?
Alphalens compares the relative forward performance of different baskets of securities formed by sorting on the factor you're analyzing. This approach is similar to how portfolio construction works in long/short and market-neutral strategies. Indeed, Alphalens was originally developed by Quantopian to assess alpha factors for its long/short hedge fund.
Nevertheless, Alphalens' usefulness isn't limited to analyzing long/short or long-only strategies that target baskets of stocks. Think of Alphalens as a tool that can help you understand how different factors "tilt the scales" of a stock's performance. In some cases, a factor you analyze with Alphalens might be strong enough to use in a trading strategy on a standalone basis. In other cases, a factor that is less strong may still be useful for identifying favorable conditions (and avoiding unfavorable conditions) for an otherwise unrelated strategy.
For example, a short seller wanting to short stocks based on medium-term price movements might use factor analysis for universe selection. The trader would identify stocks having fundamental characteristics that make the stocks prone to decline and would apply the price-based rules only to that subset of stocks.
Factor analysis helps you understand how the market works, which is useful for any trader, not just factor investors.
From Pipeline to Alphalens
Pipeline and Alphalens pair nicely, as you can pass a pipeline object directly to Alphalens and get a tear sheet, using the from_pipeline() function.
Below, I tell Alphalens to split stocks into 4 quantiles based on operating margin. Because zero marks the boundary between unprofitable and profitable companies, I specify zero_aware=True, which will cause Alphalens to reserve 2 of the 4 quantiles for stocks with negative operating margins and the other 2 quantiles for stocks with positive operating margins. I run a 25-year analysis, instructing Alphalens to analyze forward returns over the subsequent 1, 5, and 21 trading days (approximately 1 month). For more detailed explanations of the parameters shown below, see the accompanying notebook linked at the end of the article.
from zipline.pipeline import Pipeline
import alphalens as al

pipeline = Pipeline(
    columns={
        'profitability': operating_margin,
    }
)

al.from_pipeline(
    pipeline,
    start_date="1998-02-01",
    end_date="2022-12-30",
    # name of the pipeline column containing the factor to analyze
    factor="profitability",
    # split the data into 4 quantiles, by profitability
    quantiles=4,
    # don't mix positive and negative values in a single quantile
    zero_aware=True,
    # analyze forward returns over 1, 5, and 21 trading days
    periods=[1, 5, 21],
    # run the analysis in 1-year chunks to reduce memory usage
    segment="Y"
)
Results
Alphalens packs a lot of information into a tear sheet. Let's look at a few highlights.
Factor Distribution
According to the count % column of the tear sheet's factor distribution table, approximately one-fourth of companies have negative operating margins (factor quantiles 1 and 2, containing 13% of companies each), and the remaining three-fourths of companies have positive operating margins (factor quantiles 3 and 4). The mean column shows that the average operating margin of companies in the top quantile is 23%, while the average operating margin of companies in the bottom quantile is -66% (equivalent to spending $166 dollars for every $100 of revenue).
| min | max | mean | std | count | avg daily count | count % | |
|---|---|---|---|---|---|---|---|
| Factor Quantile | |||||||
| 1 (most negative) | -1.000 | -0.095 | -0.658 | 0.326 | 2,666,109 | 425.1 | 13.2% |
| 2 | -0.373 | -0.000 | -0.070 | 0.060 | 2,662,992 | 424.7 | 13.2% |
| 3 | 0.000 | 0.126 | 0.056 | 0.029 | 7,397,978 | 1179.7 | 36.8% |
| 4 (most positive) | 0.092 | 0.965 | 0.234 | 0.136 | 7,394,852 | 1179.2 | 36.8% |
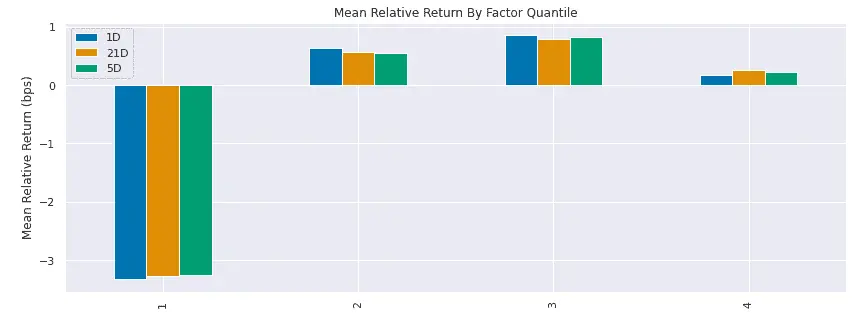
Mean Relative Return by Factor Quantile
Companies with the worst operating margins (quantile 1) perform poorly compared to other quantiles. Interestingly, there is not much difference in performance among the other 3 quantiles (which include companies with somewhat negative, somewhat positive, and very positive operating margins, respectively). Investors are apparently not rewarded for seeking out the most profitable companies but are punished for owning the most unprofitable companies.
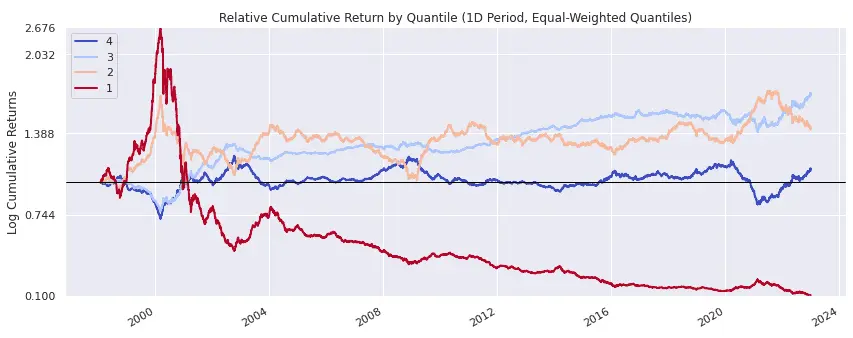
Relative Cumulative Return by Quantile
A mean return plot only shows us the average and not how we got there. The next plot shows the cumulative return (on a relative basis) of each of the 4 quantiles. The overall underperformance of quantile 1 (very unprofitable companies) is again evident, but we see that quantile 1 sharply outperformed during the dotcom bubble of the late 1990s, when investors piled into unprofitable companies.
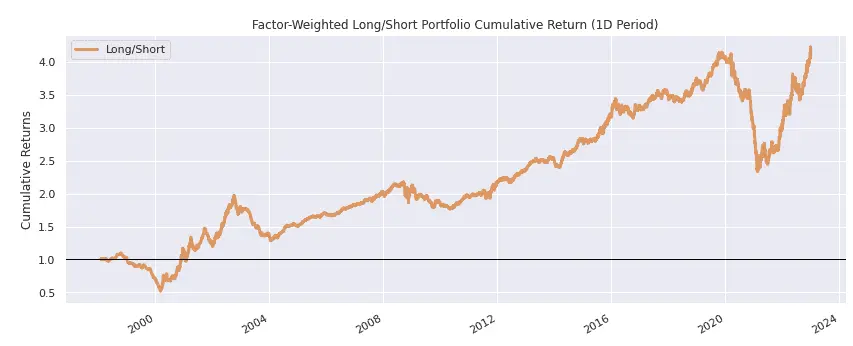
Factor-Weighted Cumulative Return
The next plot shows the cumulative return of a factor-weighted long/short portfolio constructed by buying profitable companies and shorting unprofitable companies. Such a portfolio would have generally trended higher but would have suffered drawdowns during the dotcom bubble as well as during several other periods when investors favored unprofitable companies, including during early-stage bull markets in 2003 and 2009 and during the pandemic rally of 2020-2021.
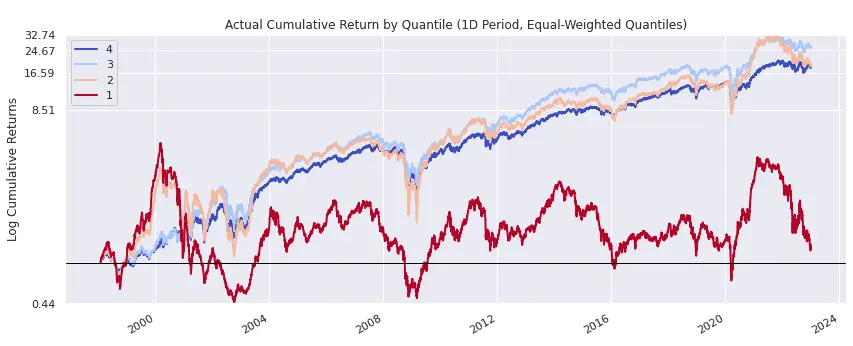
Actual Cumulative Return by Quantile
The plot of relative cumulative return by quantile that we looked at above showed the long-term relative decline of quantile 1 over time. The next plot shows the actual (not relative) cumulative return of each quantile. Here we see that the poor relative performance of quantile 1 occurred not because unprofitable companies trended lower as a group but rather because they failed to trend upward with other companies. In other words, the problem with investing in unprofitable companies is not that you lose all your money but that, for the excitement of volatility, you miss out on the long-term uptrend of the broader market.
Explore this research on your own
This research was created with QuantRocket. Clone the fundamental-factors repository to get the code and perform your own analysis.
quantrocket codeload clone 'fundamental-factors' Send a Message