Sector Neutralization: Why It Matters and How to Use It
Mon Aug 21 2023 by Brian StanleySector neutralization is a technique to hedge out sector bets and reduce the impact of sector-specific risks on the portfolio by ranking factors within sectors rather than across sectors. This post uses the debt-to-equity ratio to show why sector neutralization is important and how to perform it in Pipeline.
Debt-to-Equity Ratio: Sector Differences
Many fundamental metrics naturally vary across sectors and industries. These variations don't reflect better or worse companies but simply reflect the different ways different industries operate. Sector neutralization can be useful with these kinds of metrics.
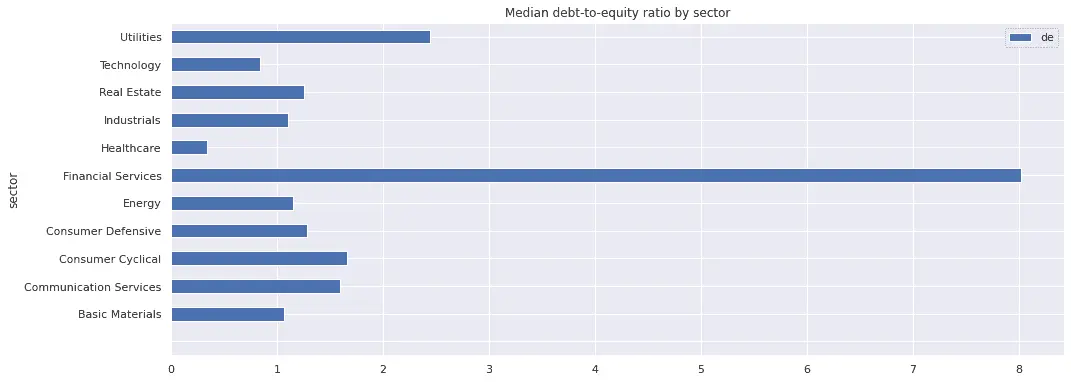
Below, I plot the median debt-to-equity ratio by sector. The median D/E ratio for the financial sector is much higher than for other sectors. Consider that banks use debt (money borrowed from depositors) to earn income by making loans, so debt-to-equity ratios are high. Meanwhile, the median D/E ratio for the healthcare sector is considerably lower than for other sectors. This is largely driven by biotech companies, which due to their speculative nature tend to be financed by equity rather than debt.
Concentration Risk
If we form a portfolio by ranking stocks on D/E ratio, the financial sector will be over-represented at one end of the portfolio and the healthcare sector will be over-represented at the other end. We can visualize this concentration risk with Pipeline.
Below, I rank stocks by D/E ratio and form quintiles from the ranks, including sector in the pipeline output:
from zipline.pipeline import master, sharadar, Pipeline
from zipline.research import run_pipeline

fundamentals = sharadar.Fundamentals.slice('ART')
de = fundamentals.DE.latest
sector = master.SecuritiesMaster.sharadar_Sector.latest

pipeline = Pipeline(
    columns={
        'quintiles': de.rank().quintiles(),
        'sector': sector,
    }
)

results = run_pipeline(pipeline, '2022-12-30', '2022-12-30')
To establish a baseline, I first plot the relative size of different sectors by counting the number of securities in each sector. We can see that Financial Services, Healthcare, and Technology are the largest sectors by number of securities:
securities_by_sector = results.groupby('sector').quintiles.count()
securities_by_sector.plot(kind="pie", title="Number of securities by sector")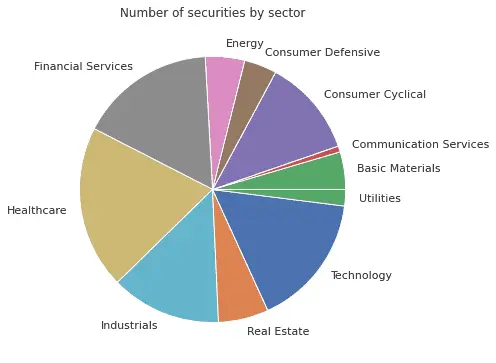
Next, I plot the sector breakdown of the lowest and highest quintiles by D/E ratio:
# the quintile labels are zero-indexed, meaning quintile 0 contains stocks with
# the lowest D/E ratios, and quintile 4 contains stocks with the highest D/E ratios
lowest_quintile_by_sector = results[results.quintiles == 0].groupby('sector').quintiles.count()
highest_quintile_by_sector = results[results.quintiles == 4].groupby('sector').quintiles.count()

lowest_quintile_by_sector.plot(kind="pie", title="Number of securities in lowest DE quintile by sector")
highest_quintile_by_sector.plot(kind="pie", title="Number of securities in highest DE quintile by sector")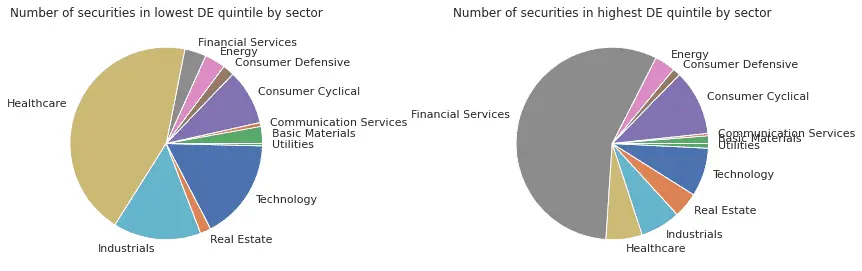
As expected, healthcare stocks dominate the low D/E quintile, and financial stocks dominate the high D/E quintile. Consequently, a long-short portfolio formed using the D/E ratio would largely be just a bet on healthcare vs financials.
Sector-Neutral Ranking
To avoid sector concentration, we can incorporate the sector into the ranking process by using the groupby parameter of rank(). Normally, the rank() method ranks all securities from 1 ⭢ N, where N is the number of securities in the universe. In contrast, rank(groupby=sector) ranks securities from 1 ⭢ N within each sector, where N is the number of securities in the sector. In the resulting output, if there are Y sectors, there will be Y stocks ranked 1, Y stocks ranked 2, etc. Ranking by sector will allow us to form a portfolio in which each sector is equally represented.
The following pipeline expression ranks by D/E ratio within sectors, then forms quintiles from the resulting ranks:
neutral_quintiles = de.rank(groupby=sector).quintiles()I plot the sector breakdown of the low D/E quintile in the portfolio formed without sector neutralization (on the left) and in the portfolio formed with sector neutralization (on the right). Sector neutralization has eliminated the over-weighting of healthcare and balanced the sectors:
lowest_quintile_by_sector_neutralized = results[results.neutral_quintiles == 0].groupby('sector').neutral_quintiles.count()

lowest_quintile_by_sector.plot(kind="pie", title="Number of securities in lowest DE quintile by sector (not neutralized)")
lowest_quintile_by_sector_neutralized.plot(kind="pie", title="Number of securities in lowest DE quintile by sector (neutralized)")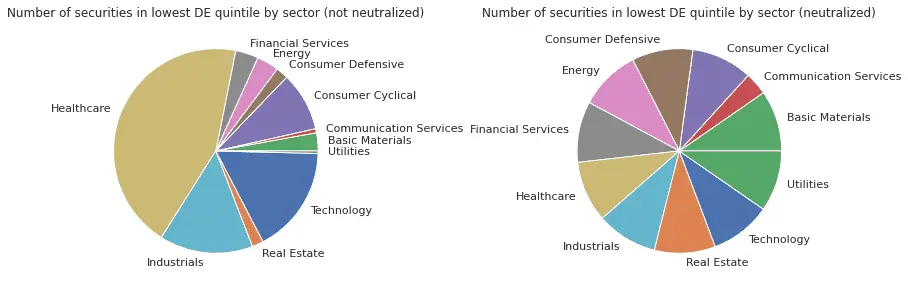
Demeaning by Sector
Ranking factors within sectors is not the only way to neutralize sectors. Another approach is to demean factors within each sector. With demeaning, we calculate the mean D/E ratio for each sector and subtract it from the observed values. Accordingly, the resulting values are centered around zero for each sector, which allows us to better compare values across sectors. If we rank stocks on their demeaned D/E ratios, we are ranking them not on their absolute D/E ratio but on their D/E ratio relative to the sector average.
The following pipeline expression forms quintiles from sector-demeaned D/E ratios:
demeaned_quintiles = de.demean(groupby=sector).quintiles()Z-Scoring by Sector
Alternatively, we can z-score the D/E ratios, which is like demeaning but includes the additional step of dividing the demeaned values by the standard deviation of D/E ratios for the sector. Whereas demeaning neutralizes the effect of one sector having generally higher or lower D/E ratios than another sector, z-scoring additionally removes the effect of one sector having a wider variation of D/E ratios than another sector.
To z-score in Pipeline, just use zscore() instead of demean():
zscored_quintiles = de.zscore(groupby=sector).quintiles()Note that, unlike the ranking approach shown above, demeaning and z-scoring don't guarantee that your quantiles will be equally weighted among all sectors. It is still possible that the best or worst D/E ratios will cluster more in one sector than another, even after adjusting for sector differences. Moreover, since some sectors are larger than others, we should naturally expect that those larger sectors will make up a larger portion of any given quantile, on average.
Should you always neutralize sector exposure?
For illustration, I intentionally chose a factor for this article that varies significantly across sectors. Many factors vary less, making sector neutralization less important. Even for factors with significant sector differences, sometimes gaining factor exposure may be more important than being sector neutral. For example, if targeting a growth factor leads you to be overweight technology, you may consider that acceptable. At the very least, however, it's a good idea to understand your sector exposures.
Explore this research on your own
This research was created with QuantRocket. Clone the fundamental-factors repository to get the code and perform your own analysis.
quantrocket codeload clone 'fundamental-factors' Send a Message