Financial Distress Factors: the Altman Z-Score and Interest Coverage Ratio
Wed Sep 06 2023 by Brian StanleyAre rising interest rates straining balance sheets and increasing the risk of bankruptcies? This article investigates two financial distress factors, the Altman Z-Score and interest coverage ratio, to see if distress is on the rise and how it impacts stock returns.
Zombie Firms in the News
Last fall, as the Federal Reserve aggressively raised interest rates, the Economist published an article about so-called "zombie firms," defined as companies that don't earn enough income to cover the interest expense on their debts. Zombie firms are not financially viable but continue to operate, often through additional borrowing. With interest rates rising, the article warned, the number of zombie firms could be expected to rise.
The article piqued my interest but lacked quantitative detail. I wondered precisely to what extent companies are struggling with greater interest costs and whether a trader or investor can capitalize on that knowledge, either by avoiding zombie firms in their portfolio or perhaps even shorting them.
Among the benefits of quantitative research is that it can confirm, qualify, or refute the ideas you read in the news. In contrast, discretionary investors have only their own cognitive biases with which to evaluate news articles. Such investors often embrace or reject ideas based on what happened last year (recency bias), or what happened in a memorable year like 1987 or 2008 (salience bias), or whether the idea supports their existing investment thesis (confirmation bias). Investors without quantitative tools risk committing capital to weak or sensationalized ideas that are not supported by the data.
The Interest Coverage Ratio and the Altman Z-Score
For perspective on the Economist article, I use Pipeline and Alphalens to analyze the interest coverage ratio, which is calculated by dividing a company's earnings before interest and taxes (EBIT) by its interest expenses for the same period. A zombie firm is defined as a company with an interest coverage ratio (ICR) below 1, indicating that the company has less earnings than interest expenses.
To widen the analysis, I also include a second financial distress factor, the Altman Z-Score. This score measures a company's likelihood of going bankrupt within two years. It is calculated as a linear combination of 5 weighted business ratios, with the weights determined by fitting a logistic regression model to a dataset of bankrupt and non-bankrupt companies. The Altman Z-score formula is:
Altman Z Score = 1.2A + 1.4B + 3.3C + 0.6D + 1.0E
Where:
- A = working capital / total assets
- B = retained earnings / total assets
- C = earnings before interest and tax / total assets
- D = market value of equity / total liabilities
- E = sales / total assets
Altman Z-Scores are often interpreted as follows:
- Z-Score >= 3: "Safe" Zone
- 0 < Z-Score < 3: "Grey" Zone
- Z-Score < 0: "Distress" Zone
Is Financial Distress on the Rise?
First, I look at the prevalence of financial distress over time.
Pipeline contains built-in factors for the Altman Z-Score and the interest coverage ratio. In the following code, I define companies with an Altman Z-Score below 0 as "distressed" and companies with an ICR below 1 as "zombies." However, I limit the zombie classification to companies with debt-to-equity ratios above the market-wide median, to ensure the company has enough debt to make the low ICR a burden.
from zipline.pipeline import sharadar
altman = sharadar.AltmanZScore()
are_distressed = altman < 0
icr = sharadar.InterestCoverageRatio()
de = sharadar.Fundamentals.slice("ART").DE.latest
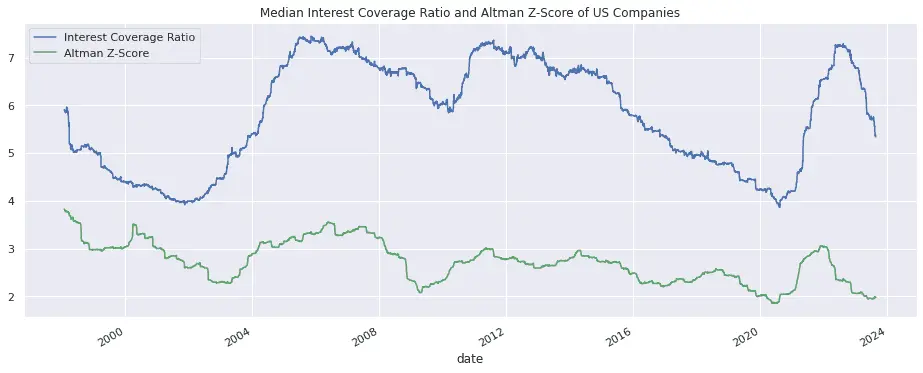
are_zombies = (icr < 1) & (de > de.median())I plot the median Altman Z-Score and median ICR over time. The median interest coverage ratio (blue line) declined throughout the 2010s from a high of 7 (earnings sufficient to cover interest expenses 7 times over) to a low of 4 shortly before the pandemic, then spiked during the pandemic (when interest rates dropped to near zero). Interest coverage ratios have declined since then but remain above pre-pandemic levels. Meanwhile, the median Altman Z-Score (green line) has generally hovered between 2 and 3 and is currently near the bottom of that range:
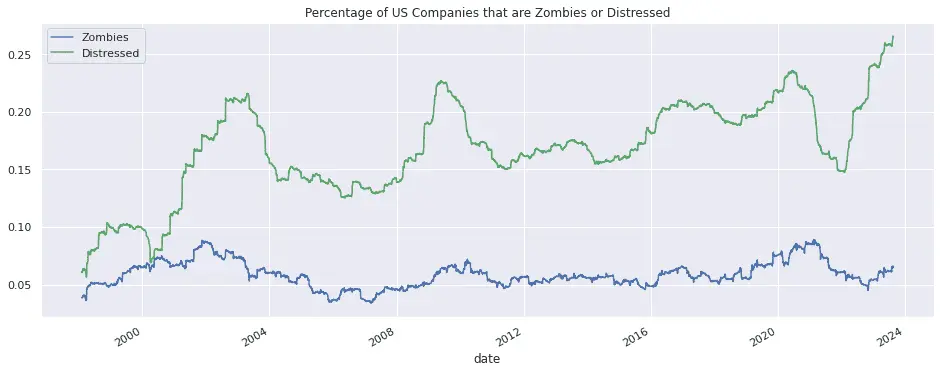
Arguably, the median values are less important than the number of companies that fall below the critical thresholds. Next I plot the percentage of firms that are zombies or Altman-distressed. The percentage of zombie firms (blue line) has been relatively stable over time and does not seem particularly elevated at present. This leads me to discount the Economist article somewhat. However, the percentage of distressed firms as measured by the Altman Z-Score (green line) has risen sharply since the end of 2021 and is currently at its highest level ever:
Impact on Stock Returns
To see if financial distress leads to poor stock performance, I split stocks into two buckets: one bucket with companies that are zombies or Altman-distressed (or both), and a second bucket with everything else. I include market cap and volatility quartiles in the Pipeline to see how the size and volatility factors interact with the financial distress factor.
from zipline.pipeline import Pipeline
from zipline.pipeline.factors import AnnualizedVolatility
import alphalens as al

pipeline = Pipeline(
    columns={
        'distressed': are_distressed | are_zombies,
        'size': marketcap.quantiles(4),
        'volatility': AnnualizedVolatility().quantiles(4)
    }
)

al.from_pipeline(
    pipeline,
    start_date="1999-02-01",
    end_date="2023-06-30",
    periods=[1, 5, 21],
    factor="distressed",
    bins=[-1, 0, 1],
    groupby=[
        "size",
        "volatility",
    ],
    segment="Y"
)
Results
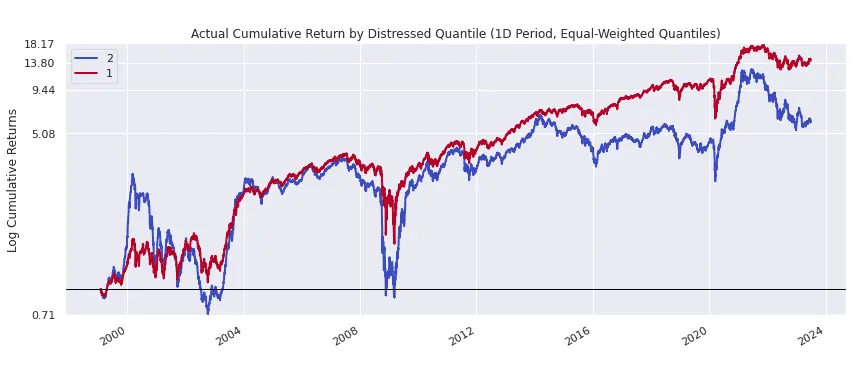
In the following plot, Altman-distressed and zombie companies are represented by quantile 2 (the blue line) while non-distressed companies are in quantile 1 (the red line). The financially distressed bucket is more volatile and underperforms over time, albeit with occasional spikes higher during speculative periods like the dotcom bubble:
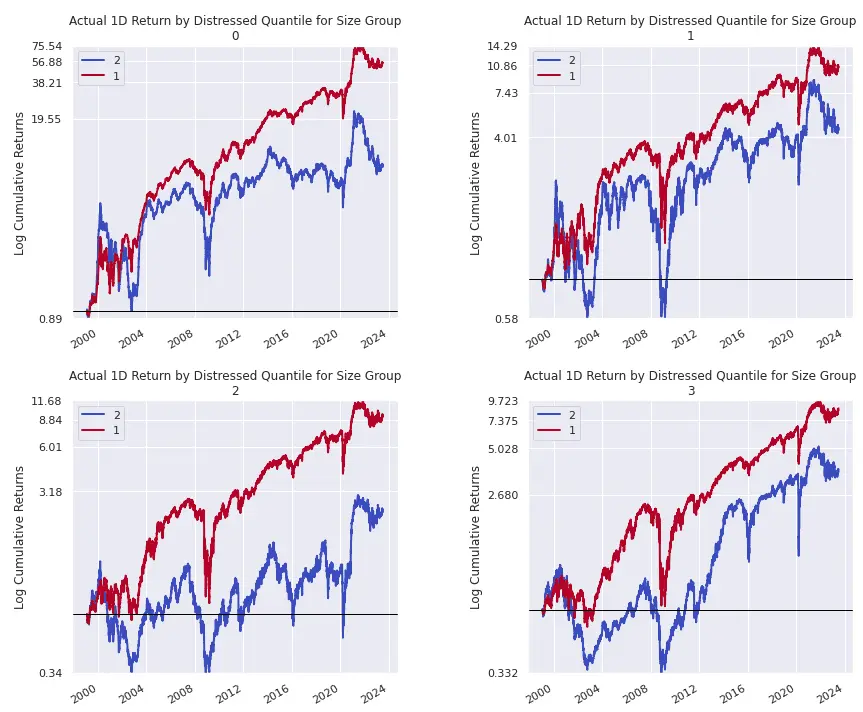
Market Cap Subgroup Analysis
The next set of plots breaks down performance by market cap quartile (where quartile 0 contains the smallest companies and quartile 3 contains the largest). The lagging performance of financially distressed stocks (blue lines) is consistent across market cap quartiles.
Volatility Subgroup Analysis
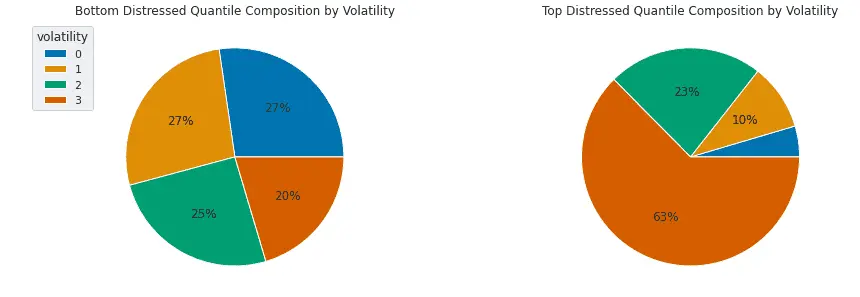
Next I look at results by volatility quartile. The left-hand pie plot shows the composition of the non-distressed bucket by volatility quartile, while the right-hand pie plot shows the composition of the distressed bucket by volatility quartile. As the right-hand plot shows, distress and volatility go hand-in-hand, with the most volatile stocks (volatility quartile 3, shaded in dark orange) making up 63% of the distressed bucket.
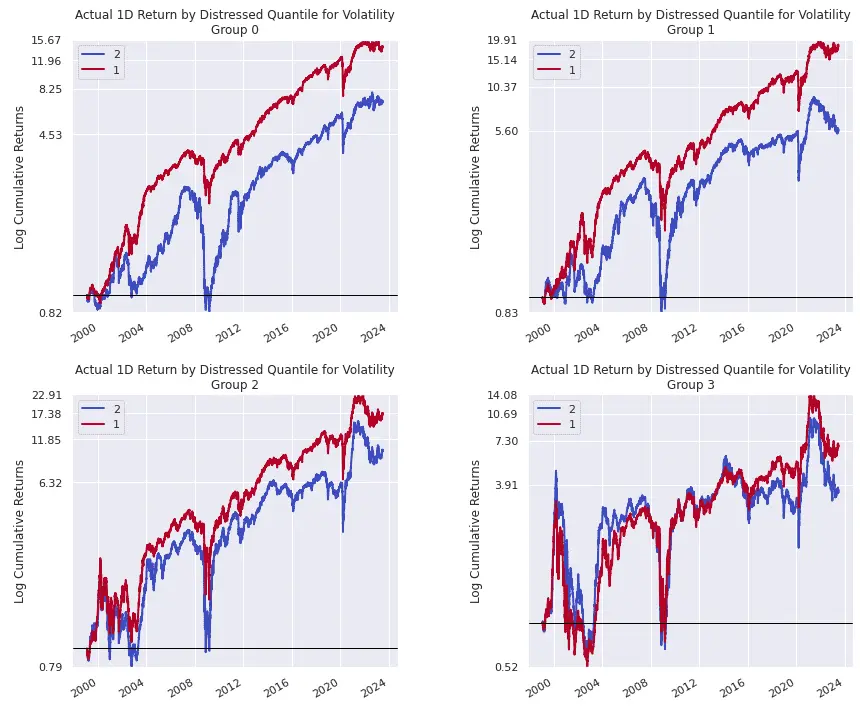
The next set of plots show the cumulative return of distressed firms (blue lines) and non-distressed firms (red lines) by volatility quartile. In volatility quartile 3 (bottom right), distressed firms underperform non-distressed firms, but the difference is small (and volatile). Combined with the right-hand pie plot above, a reasonable conclusion would be that most distressed firms are highly volatile and behave similarly to other highly volatile stocks.
In contrast, the plots for the 2 lowest volatility quartiles (quartiles 0 and 1, top left and top right) show a wider and more stable spread between distressed and non-distressed firms, suggesting that low volatility stocks are a more promising subgroup for exploiting financial distress factors. A distressed stock with low volatility seems counterintuitive (as we associate distress with volatility), but counterintuitive areas of the market are often fruitful areas for research as fewer traders are looking there.
Explore this research on your own
This research was created with QuantRocket. Clone the fundamental-factors repository to get the code and perform your own analysis.
quantrocket codeload clone 'fundamental-factors' Send a Message